Member Dashboard Guide
Every stat, tool, and metric in your dashboard exists for one reason: to keep you informed, in control, and ready to perform. This guide breaks down every section so you never have to guess what anything means.
Your main hub. The first screen you see after login. Everything you need to assess your standing at a glance.
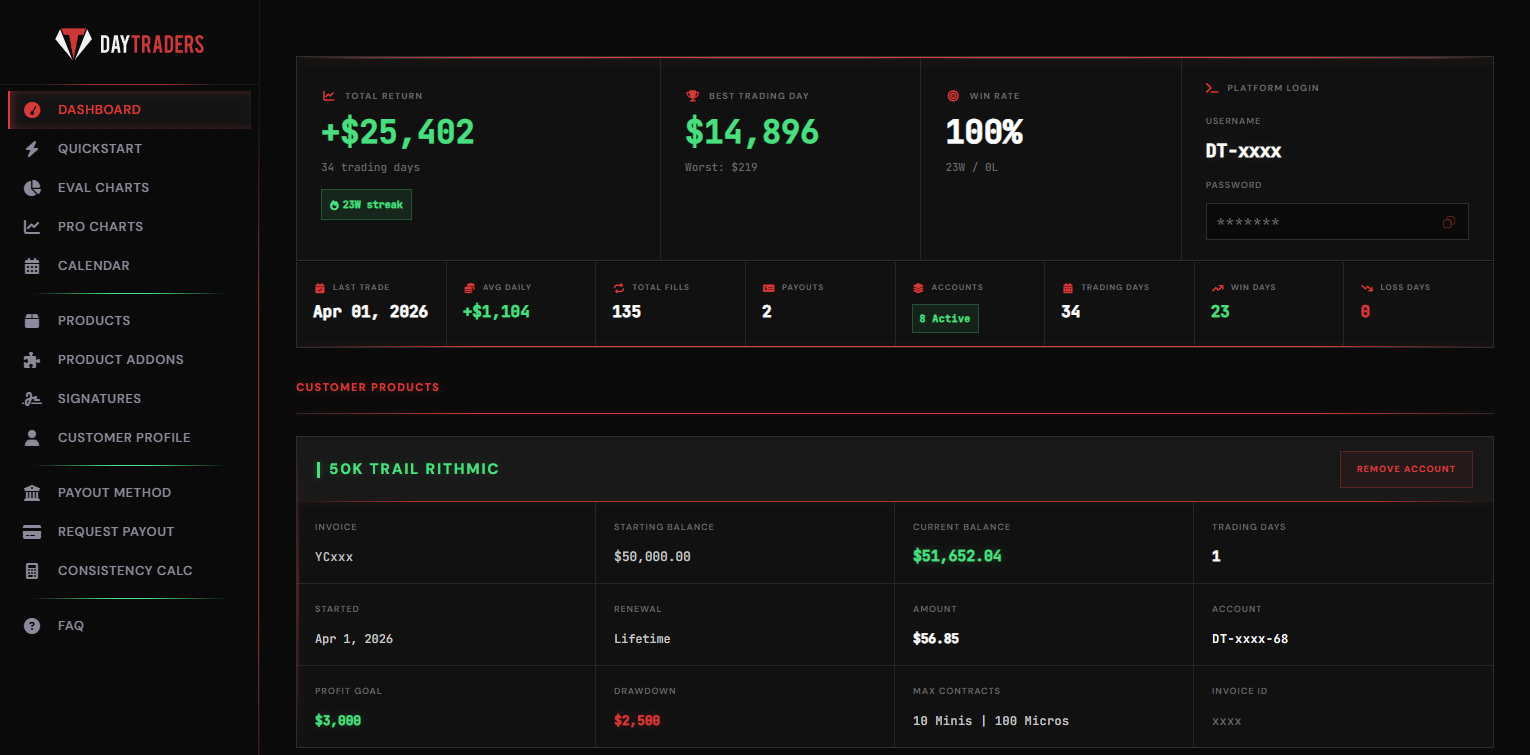
Your cumulative profit across all trading days on the selected account. This is the net result of every win and loss combined. A green number means you're in profit overall.
The single highest profit you earned in one trading session. Below it, you'll see "Worst" which shows your largest single-day loss. These help you gauge your range.
The percentage of winning days versus total days traded. Shown as a ratio like "23W / 0L" meaning 23 winning days and 0 losing days. A key metric for evaluating your consistency.
The green badge (like "23W streak") shows your current consecutive winning day streak. This resets when you have a losing day. It reflects your momentum and discipline.
Your Rithmic trading credentials. Use this username and password to log into your trading platform (like Rithmic R|Trader or any supported front-end). The copy button lets you grab the password quickly.
The bottom row gives you quick-hit data: last trade date, average daily P&L, total fills (order executions), number of payouts, active accounts, total trading days, and your win/loss day breakdown.
Scroll down on the dashboard and you'll find all your active accounts listed under Customer Products. Each product card shows:
Visual performance tracking for your funded accounts. See your balance curve, drawdown line, daily P&L bars, and more.
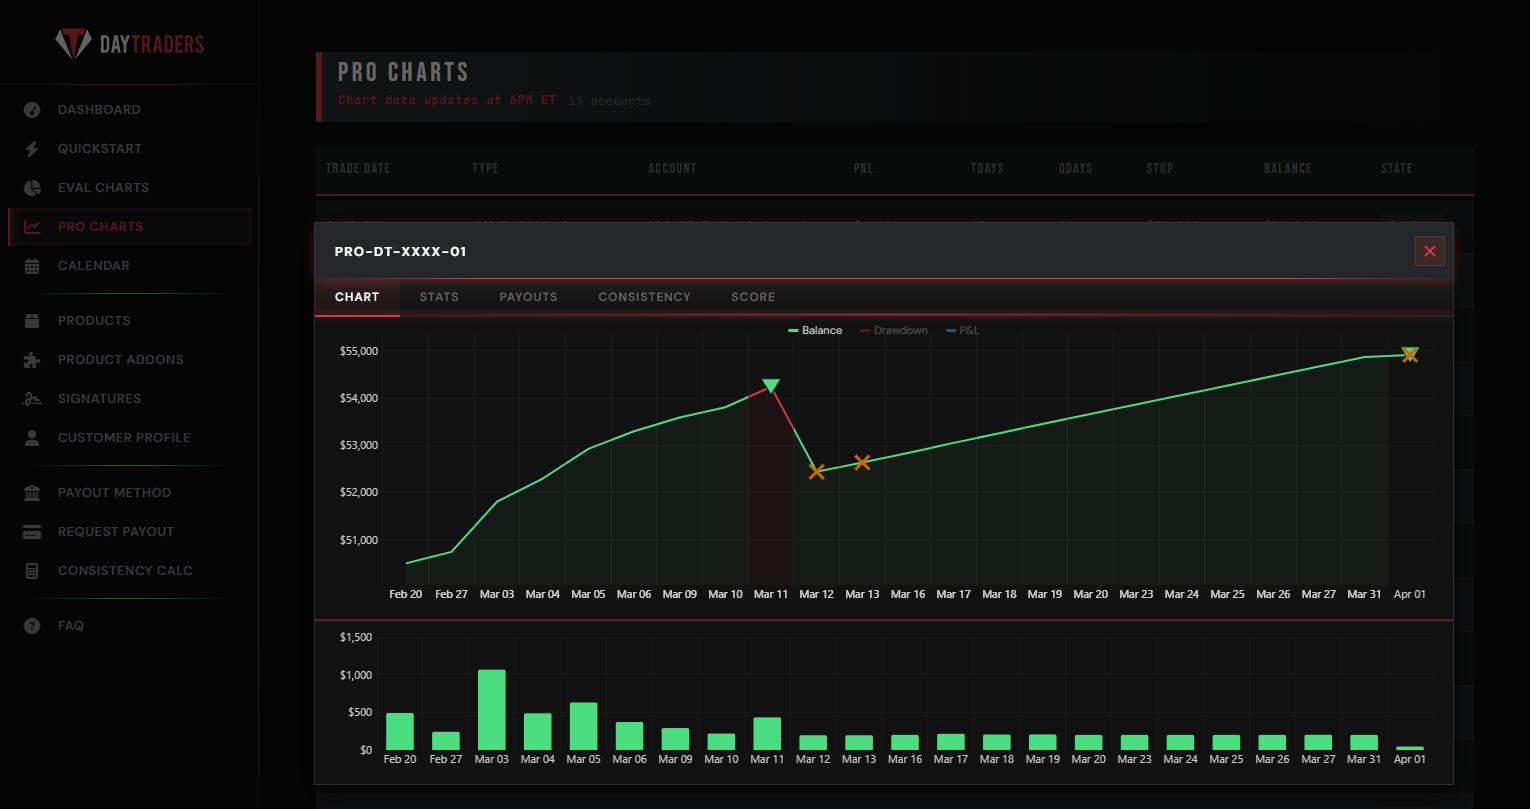
The main green line tracks your account balance over time. Each point represents your closing balance for that day. An upward slope means consistent growth. Sharp drops indicate drawdowns.
The orange line shows your trailing drawdown level. If your balance touches or crosses this line, the account is breached. The gap between the green and orange lines is your safety buffer.
The bar chart below the main graph shows your profit or loss for each individual trading day. Tall green bars are big wins. Red bars (if any) are losses. This helps you spot patterns in your daily performance.
Orange X markers on the chart indicate payout events or notable account actions. The triangle markers show specific events like drawdown resets. Hover over them for more detail.
Each account popup has tabs: Chart (visual balance), Stats (numeric breakdown), Payouts (payout history for that account), Consistency (rule check), and Score (overall performance grade).
Above the chart, you'll see a table listing all your Pro accounts with columns for trade date, type, account ID, P&L, trading days, qualifying days, stop level, balance, and account state.
A monthly view of your daily trading results, balance snapshots, and weekly totals. Your performance diary in one clean grid.
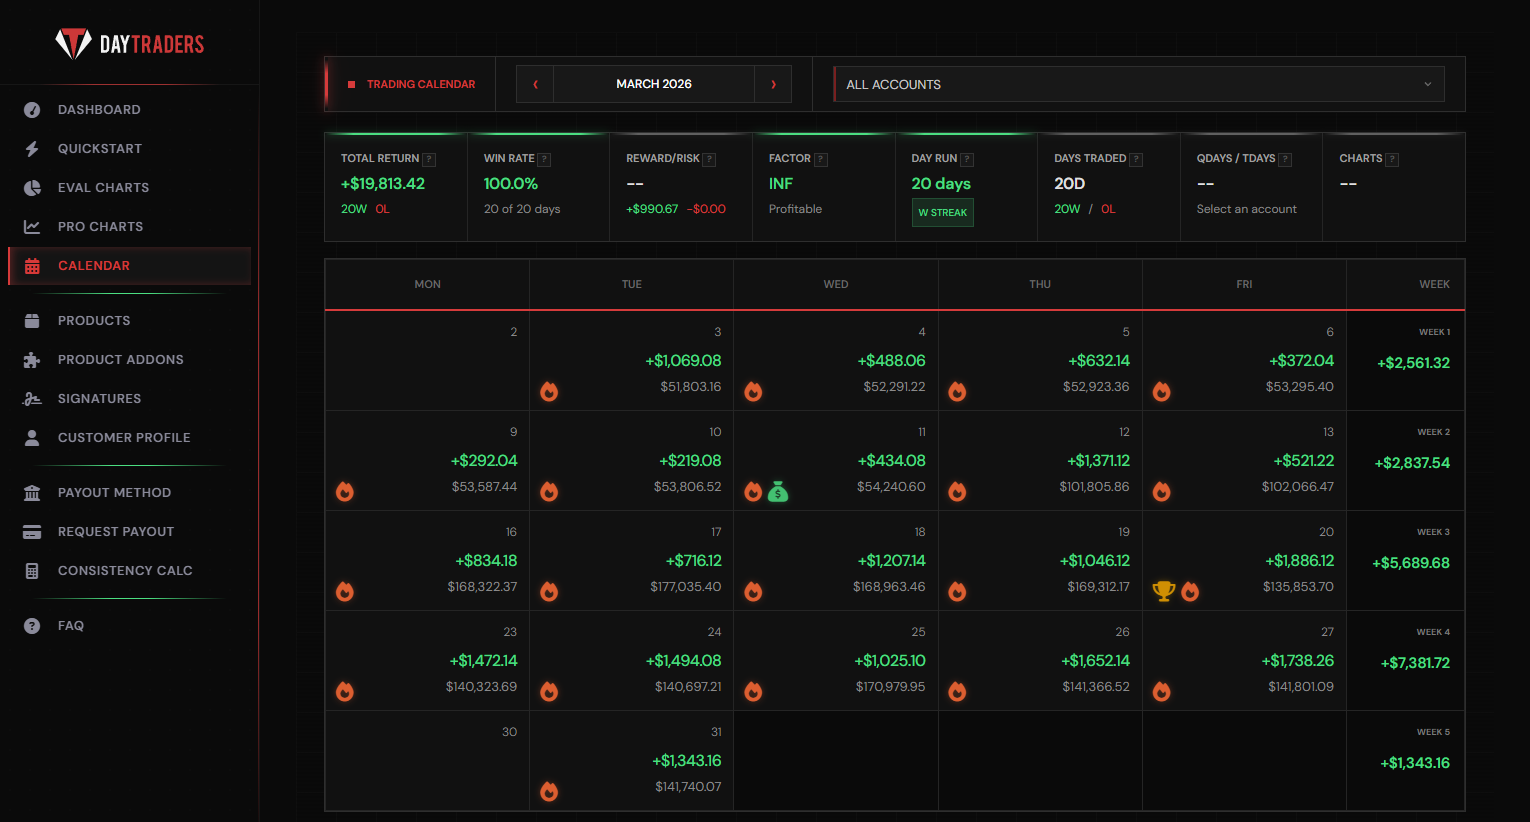
Each day shows your P&L in green (profit) or red (loss) at the top, and your account balance below it. The fire icon means you traded that day. A blank cell means no trades were placed.
The right-hand "Week" column adds up your entire week's P&L. This gives you a quick read on whether each week was net positive or negative. Great for spotting weekly patterns.
Special icons appear for milestones. The trophy icon indicates a notable achievement like a profit milestone. The dollar icon marks days with significant payouts. These celebrate your progress.
The top bar shows aggregated stats: Total Return, Win Rate, Reward/Risk ratio, Factor (profit factor), Day Run streak, Days Traded, and qualifying days. This is your month at a glance.
Use the dropdown on the top right to view the calendar for a specific account or "All Accounts" combined. When viewing all accounts, balances reflect the combined totals across your active accounts.
Use the arrows next to the month name to go forward or backward through months. The calendar keeps your full trading history so you can review any past month at any time.
Where you submit withdrawal requests and track every payout you've ever received. Transparent, fast, and fully logged.
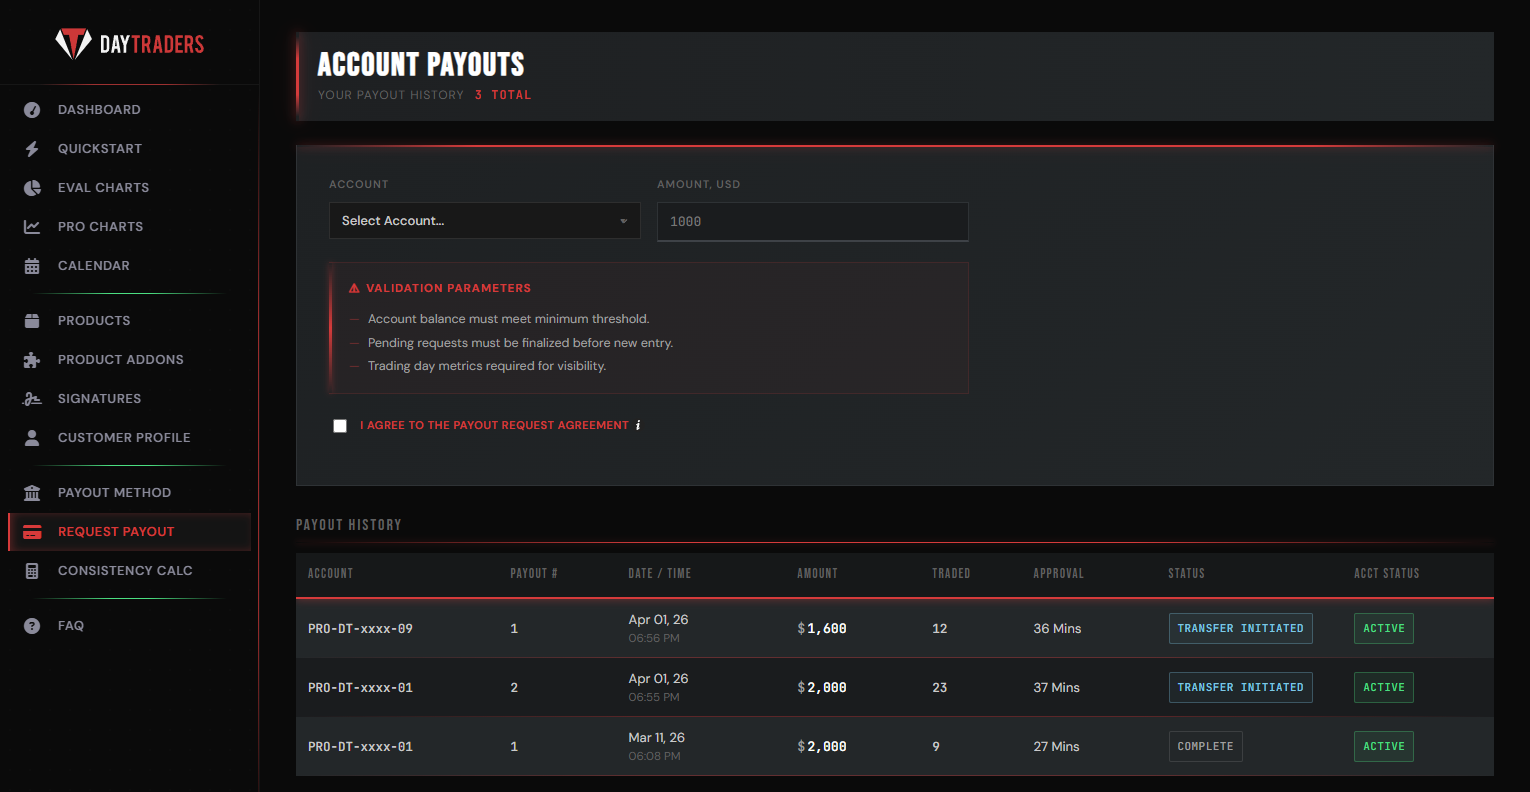
Select your account from the dropdown and enter the amount you want to withdraw in USD. Make sure you meet the minimum balance threshold and have enough qualifying trading days before submitting.
Three conditions must be met: your account balance must be above the minimum threshold, any pending payout requests must be finalized first, and your trading day metrics must be visible and qualifying.
You must check the agreement box before submitting. This confirms you understand the payout terms and that the request will be reviewed based on your account standing.
Below the form, every payout you've ever requested is logged in a table. Each row shows: the account, payout number, date/time, amount, days traded, approval time, status, and whether the account is still active.
The "Approval" column shows how quickly your payout was reviewed. Times like "36 Mins" or "27 Mins" mean your request was processed and approved in under an hour.
"Transfer Initiated" means the money is being sent to your chosen payout method. "Complete" means the funds have been delivered. "Active" under Acct Status confirms your account is still live and trading.
Check whether your daily P&L distribution passes the consistency rule before requesting a payout. No surprises.
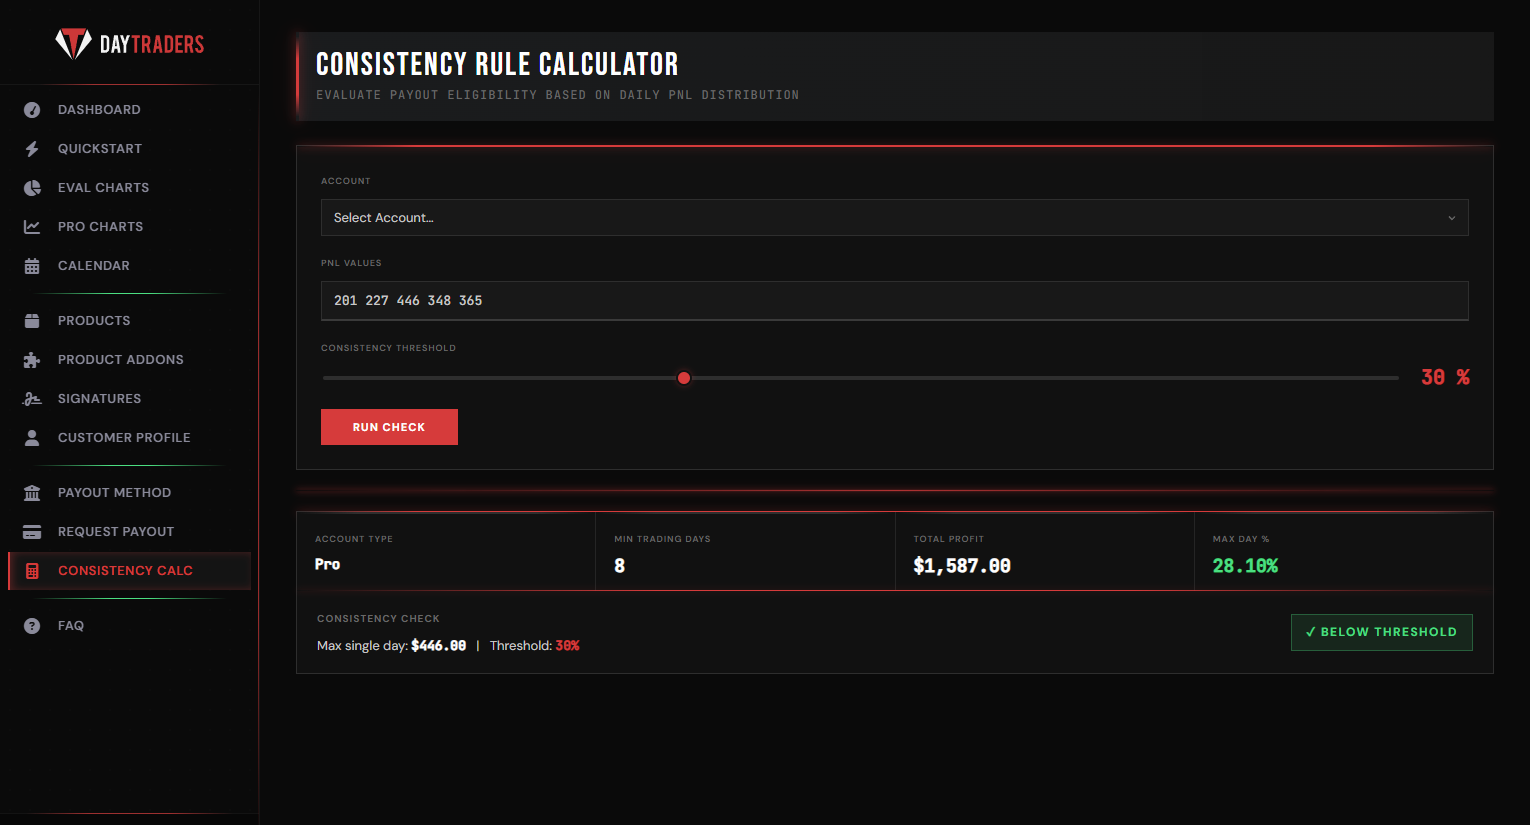
Enter your daily profit values separated by spaces (e.g., "201 227 446 348 365"). These are the individual day profits the calculator will evaluate against the consistency threshold.
The slider sets the maximum percentage any single day can represent of your total profit. At 30%, no single day's profit can exceed 30% of your total. Lower thresholds require more even distribution.
Hit "Run Check" after entering your values and setting the threshold. The calculator instantly evaluates your P&L distribution and displays the results below.
After running the check, you'll see: Account Type, Min Trading Days, Total Profit (sum of all your entered values), and Max Day % (what percentage your best day represents of the total).
The green "Below Threshold" badge means you pass. Your max single day doesn't exceed the threshold. If it shows red, your profit is too concentrated in one day and you need more balanced results.
Consistency rules exist to ensure profits come from disciplined, repeatable trading rather than a single lucky day. Use this tool to self-check before submitting a payout request so you know you qualify.
When you earn Elite status, your dashboard transforms. New stats, new tier badge, and live capital access. This is the top level.
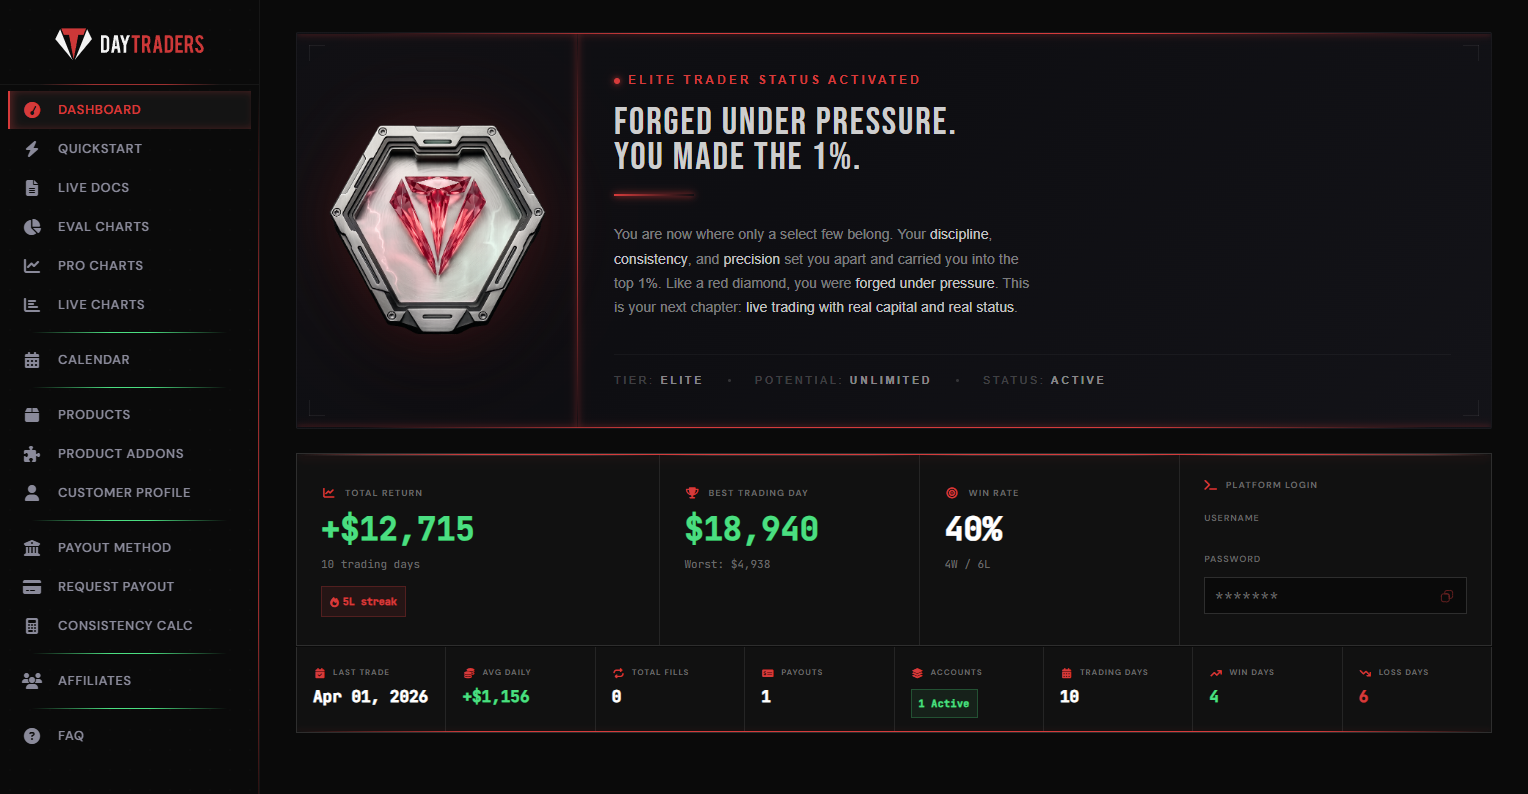
The red diamond badge and "Forged Under Pressure" header confirm you're in the top 1% of traders. Your tier is ELITE, potential is UNLIMITED, and status is ACTIVE. This is live capital territory.
Shows your total profit on the live account. Unlike eval or pro accounts, this return is generated on real market execution with real capital backing your trades.
Your best single trading day and worst day are displayed. On live accounts, these reflect real market fills and real P&L. The spread between best and worst shows your risk range.
Your win/loss ratio on the live account. A "4W / 6L" record with a 40% win rate means you're still profitable despite losing more days than winning, which means your winners are bigger than your losers.
The red "5L streak" badge shows your current consecutive loss day streak. This is a risk awareness flag. It doesn't mean your account is in danger, but it signals you should review your approach.
Live accounts unlock additional sidebar options like "Live Docs" and "Live Charts" for documentation and performance tracking specific to your live trading environment.
Our support team is ready to help you navigate every part of your dashboard. Reach out any time.
